
Do we need another diagram tool? Maybe not… But I think we can do better
My thoughts on the pitfalls of diagram tools today, the value lost, and why we can do better.

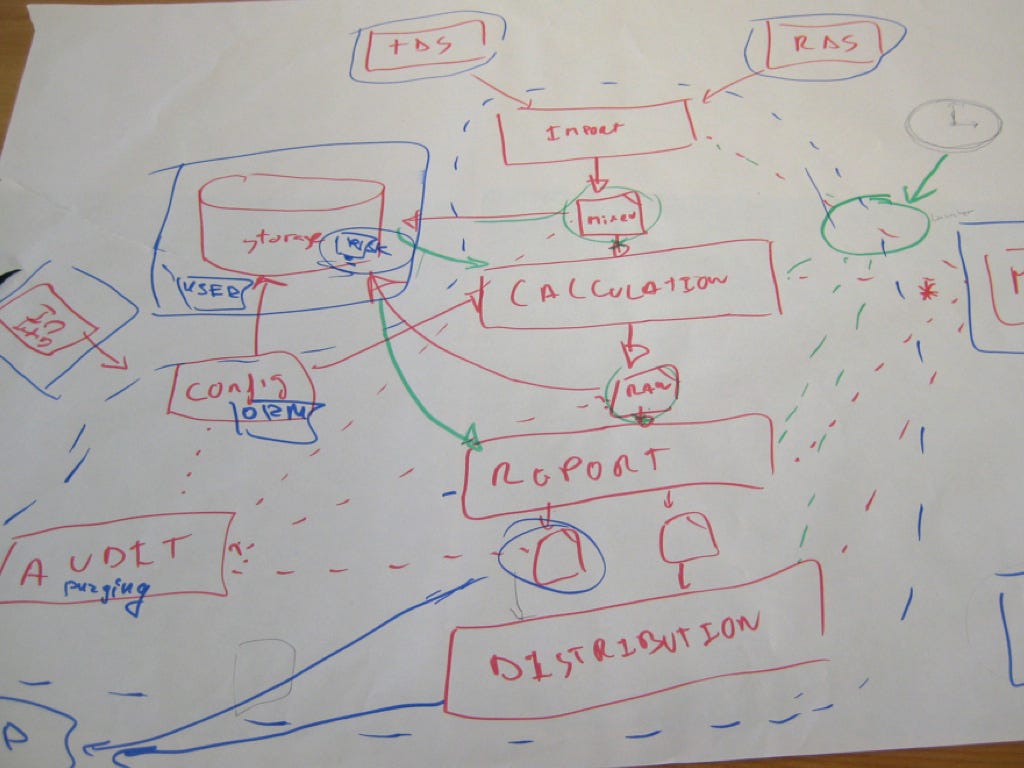
For the last 20 years, I’ve been drawing and developing software. Almost every company I worked at started with some whiteboarding or sketching of boxes and lines. Then a translation period happened—taking these drawings and turning them into an artifact. Sometimes it was more detailed diagrams, sometimes code, and sometimes just a box-ticking exercise.
About 10 years ago, I stumbled across message-based architectures (EDA) and decided to dive deep into the subject. Something about distributed, loosely coupled architectures resonated with me.
I began building solutions using patterns and techniques from this style, and something amazing happened: I saw a velocity in product engineering I had never experienced before. The speed at which we could evolve our architecture and deliver features was incredible.
So, I spent the next decade diving even deeper—speaking around the world, advocating for message-based architectures, and now building open source tools for this niche full-time.

Along the way, I discovered domain-driven design and its community. I learned domain discovery techniques like EventStorming and EventModeling. I realized how well DDD and EDA fit together, and how much value there is in bringing “the business” and development teams closer.
But I also noticed a huge problem: event discovery and documentation. The pitfalls of event-driven architecture were everywhere, and people kept running into the same issues. During Christmas 2022, I built EventCatalog. Three years later, I now spend all my time working on a product and open-source project I love—one that delivers value to thousands of companies around the world.
Still, after speaking with hundreds of companies during this journey, I felt there was something missing. There seems to be a gap between design, collaboration, implementation, documentation… and back again.
Many teams use whiteboards or sticky notes to capture information between teams, then translate those artifacts into something else—or let them die.
So, I ask myself: can we do better?
Designing with primitives and patterns
Many teams use tools like Miro, Lucidchart, Visio, and the C4 Model. These are great for digital representations of thought and design. But I often wonder: what if we modeled and designed with the actual primitives (e.g. domains, messages, services) we’ve been talking about for decades—rather than just boxes and lines?
Patterns and primitives in software architecture tend to stand the test of time. Look at books like Domain-Driven Design or Enterprise Integration Patterns—both more than 20 years old and still widely referenced. If you take technology out of the equation, the patterns remain. They can be translated across industries and technologies.
So why can’t we design directly with the patterns and primitives we already know, and then export artifacts we can actually use? Not necessarily replacing techniques like EventStorming or EventModeling—but giving people a canvas and tool where they can do more.
For example: if we want to represent a message (e.g. an event) in a design, why can’t we define its name, rules around it, start planning its schema, and share it with teams in a tool? And in the future, if the schema changes, why can’t the tool help us see who will break?
If we want to do EventStorming or EventModeling, why can’t we assign views, actors, and services with more definition if we choose to? Why does it all have to be static boxes?
Most teams have their own patterns and golden paths in architecture. Why not capture these and let people design with them? If you have a particular way of doing change data capture, or handling dead-letter queues, why not create reusable blocks for them?
And with the rise of AI, if our designs have a standard output, why not let LLMs help us verify them? Generate templates? Move from design to implementation faster?
Either way, I think we’re leaving a huge amount of value on the floor—and I believe we can do better.
That’s why I started my next open source project; EventCatalog Studio.
What’s next
So, do we need another diagram tool? Probably not. But I can’t help but feel we can do better.
Over the past few months, I’ve been putting together a new open-source tool called EventCatalog Studio, built around my own pain points. It’s a tool focused on primitives and patterns—technology-agnostic by design.

I have no idea if it will fail or succeed. But I’m driven to make this ecosystem better for everyone, and to push the boundaries of what we do today into a better future.
If you’d like to join me on this journey, feel free to hop into our Discord. And if you ever want to geek out, connect with me—I’d love to chat.
We definitely and urgently need new modeling tools not diagramming tools. The "diagrams" and their elements are to models like letters and words and sentences and paragraphs and chapters are to stories. The actual content manipulated must be a model with the abstractions one actually thinks about. With the most popular tools the only abstractions are boxes and arrows themselves. Not activities, not events, not entities, not control flows, not data flows. The specialised tools e.g. for BPMN and UML and EPC and UPN for activity flows offer notations that were good as starting points in the 90ies but absolutely inacceptable as the end of all efforts. We can and must do better. Everyone is waffling about AI and yes LLMs do help a lot. But a totally overlooked space are high-usability visual graph editors of all sorts: true visual modeling tools. They, too, had their Winter (CASE tools) but the opportunities are great because they offer a path to higher human intelligence and understanding combined with better machine understanding. They offer rather formal specifications while still feeling intuitive. But the tooling is rotten these days and the standard notations actually block innovation. I prefer to do my tax declaration over using Sparx EA and that says a lot. So by all means go on building modeling tools based on boxes and arrows: graphs. There are some folks who aren't visual thinkers but for those that are they can operate and understand way faster and better. My personal approach is #deepmodeling as I see the IT world as a quasi-fractal with depth and a tool like Google Maps/Earth but for editing is the way to go. For all critics of boxes and arrows: go try to manage life without maps of the Earth.